This notebook describes the analysis of a snapshot of all replicas in the CMIP5 archive on February 6th 2013. A list of all dataset versions at each of the 3 replicating data centres is read, analysed and compared with the total number of datasets listed in the CMIP5 archive.
This analysis uses the following terminology:
- Dataset: A unit of data published into the system.
- Dataset Version: A particular version of a dataset. Each dataset version has a datestamp and datasets can be updated by publishing new dataset versions.
- Latest dataset: The dataset version which is the most up to date of a particular dataset.
Initation and data import
In[28]:
import pandas as p
import matplotlib.pyplot as plt
import itertools as itr
from matplotlib_venn import venn3
from pyesgf.search import SearchConnection

def make_venn(replicas):
    """
    Create a venn diagram from a dictionary of replica sets
    """
    def f(*cs):
        inc_s = reduce(lambda x, y: x.intersection(y),
                       (replicas[x] for x in cs))
        exclude = [x for x in replicas if x not in cs]
        if len(cs) < len(replicas):
            exc_s = reduce(lambda x, y: x.union(y),
                           (replicas[x] for x in exclude))
        else:
            exc_s = set()
        return len(inc_s.difference(exc_s))

    rows = [('badc',), ('pcmdi',), ('badc', 'pcmdi'),
            ('dkrz',), ('badc', 'dkrz'), ('pcmdi', 'dkrz'),
            ('badc', 'pcmdi', 'dkrz')]

    subsets = p.Series([f(*x) for x in rows], index=rows)

    return (venn3(subsets=subsets, set_labels = ['badc', 'pcmdi', 'dkrz']), subsets)

def by_institute(replicas):
    """
    Take a set of replicas and return a dictionary of sets where each key is
    the institute.  Account for some naming anomalies.
    """
    ret = {}
    for centre in replicas:
        institutes = ret[centre] = {}
        for drs in replicas[centre]:
            parts = drs.split('.')
            if parts[0] != 'cmip5':
                continue
            if len(parts) == 10:
                (activity, product, institute, model, experiment, frequency, realm, table, ensemble, version) = parts
            else:
                (activity, product, institute, model, experiment, frequency, realm, table, ensemble) = parts
            # Account for metadata anomalies
            institute = institute.lower()
            if institute == 'noaa-ncep':
                institute == 'ncep'
            institutes.setdefault(institute, set()).add(drs)
    return ret
Read in the lists of dataset versions at each centre and calculate the sets of datasets and latest datasets
In[29]:
replica_lists = %system ls *_replicated_dataset_*.txt

replicas = {}          # Dictionary of sets of replica dataset versions
replicas_ds = {}       # Dictionary of sets of replica datasets
latest = {}            # Dictionary mapping dataset id to latest version
replicas_latest = {}   # Dictionary of sets of replica latest datasets

for replica_list in replica_lists:
    centre = replica_list.split('_')[0]
    s = replicas[centre] = set()
    for line in open(replica_list):
        s.add(line.strip())

# These counts no not include the original datasets for MOHC heald at BADC
# or the MPI-M datasets held at DKRZ.  To account for this we add all the
# MOHC output1 dataset versions held at BADC.
for line in open('badc_mohc_output1.txt'):
    replicas['badc'].add(line.strip())

# We have to get the DKRZ datasets by querying the ESGF API
#conn = SearchConnection('http://esgf-data.dkrz.de/esg-search', distrib=False)
#ctx = conn.new_context(project='CMIP5', product='output1', institute='MPI-M')
#for r in ctx.search():
#    replicas['dkrz'].add(r.json['instance_id'])

# The above block is cached into this data file
for line in open('dkrz_mpih_output1.txt'):
    replicas['dkrz'].add(line.strip())

for c in replicas:
    ds_iter = ('.'.join(x.split('.')[:-1]) for x in replicas[c])
    replicas_ds[c] = set(ds_iter)

for dv in replicas['badc'] | replicas['dkrz'] | replicas['pcmdi']:
    version = int(dv.split('.')[-1][1:])
    ds = '.'.join(dv.split('.')[:-1])
    latest[ds] = max(latest.get(ds, 0), version)

for c in replicas:
    s = replicas_latest[c] = set()
    for dv in replicas[c]:
        version = int(dv.split('.')[-1][1:])
        ds = '.'.join(dv.split('.')[:-1])
        if version == latest[ds]:
            s.add(dv)
In[30]:
p.DataFrame({
             'dataset versions': dict((k, len(v)) for (k, v) in replicas.items()),
             'datasets': dict((k, len(v)) for (k, v) in replicas_ds.items()),
             'latest datasets': dict((k, len(v)) for (k, v) in replicas.items()),
            })
Out[30]:
dataset versions datasets latest datasets badc 29057 24539 29057 dkrz 37062 31072 37062 pcmdi 39101 39101 39101
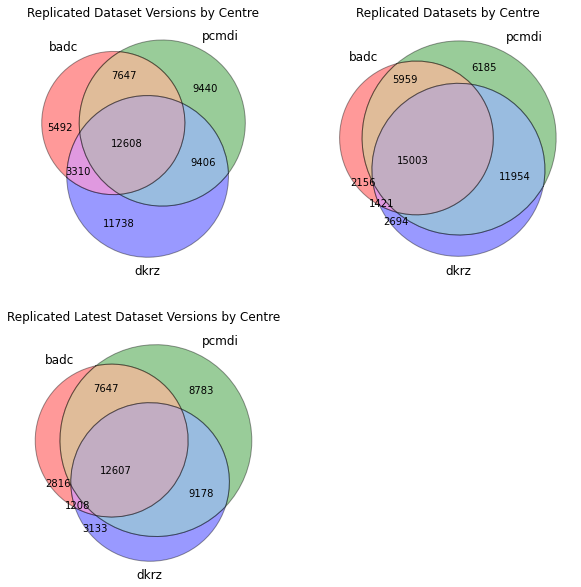
Intersection of dataset replicas
We plot the venn diagrams showing the intersection of datasets, dataset versions and latest datasets at each centre.
In[31]:
fig = plt.figure(figsize=(10,10))
ax1 = fig.add_subplot(2,2,1)
ax1.set_title('Replicated Dataset Versions by Centre')
venn_dv, subsets_dv = make_venn(replicas)
ax2 = fig.add_subplot(2,2,2)
ax2.set_title('Replicated Datasets by Centre')
venn_ds, subsets_ds = make_venn(replicas_ds)
ax3 = fig.add_subplot(2,2,3)
ax3.set_title('Replicated Latest Dataset Versions by Centre')
venn_latest, subsets_latest = make_venn(replicas_latest)
df = p.DataFrame({
                  'dataset versions': subsets_dv,
                  'datasets': subsets_ds,
                  'latest datasets': subsets_latest
                  })
df
Out[31]:
dataset versions datasets latest datasets (badc) 5492 2156 2816 (pcmdi) 9440 6185 8783 (badc, pcmdi) 7647 5959 7647 (dkrz) 11738 2694 3133 (badc, dkrz) 3310 1421 1208 (pcmdi, dkrz) 9406 11954 9178 (badc, pcmdi, dkrz) 12608 15003 12607
Breakdown of holdings by institute
We now concentrate on the latest datasets and create a breakdown of the statistics by institute
In[32]:
institute_latest = by_institute(replicas_latest)

institute_counts = {}
for c in institute_latest:
    institute_counts[c] = dict((k, len(v)) for (k, v) in institute_latest[c].items())

df_institute = p.DataFrame(institute_counts)
We now add the counts of all non-replicas in the archive by querying the ESGF Search API.
It should be noted at this point that we are making 2 assumptions when comparing these figures:
- That no replicated latest dataset has been deprecated by a subsequent version. This is unlikely to be the case as some updates to datasets have almost certainly not been replicated.
- That no dataset exists only as a replica. I.e. that no dataset has been replicated and then it's original removed.
In[33]:
conn = SearchConnection('http://pcmdi9.llnl.gov/esg-search')
ctx = conn.new_context(project='CMIP5', product='output1', latest=True, replica=False)
facet_counts = ctx.facet_counts

df_institute['archive output1'] = p.Series(facet_counts['institute'].values(),
                                   (x.lower() for x in facet_counts['institute'].keys()))

df_institute
Out[33]:
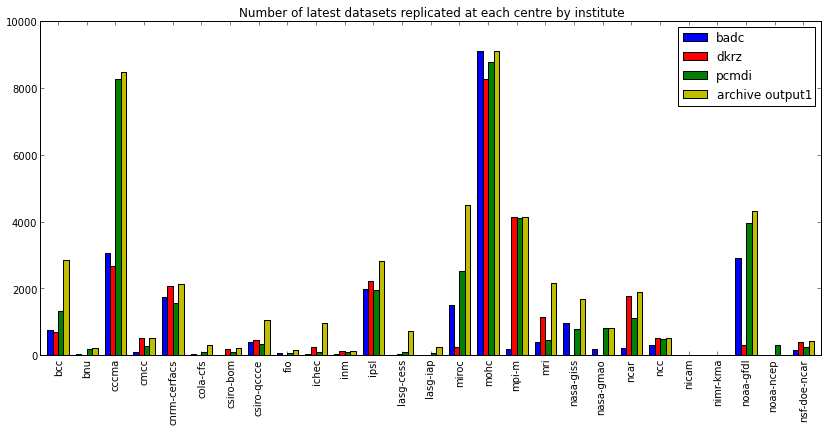
badc dkrz pcmdi archive output1 bcc 759 697 1333 2861 bnu 55 1 184 233 cccma 3049 2680 8271 8459 cmcc 107 525 280 526 cnrm-cerfacs 1753 2083 1554 2130 cola-cfs 45 NaN 115 305 csiro-bom NaN 193 95 209 csiro-qccce 392 468 348 1062 fio 74 NaN 80 160 ichec 57 246 113 965 inm 45 128 117 141 ipsl 1982 2235 1942 2831 lasg-cess NaN 35 101 725 lasg-iap NaN 18 70 259 miroc 1503 250 2533 4485 mohc 9079 8268 8759 9079 mpi-m 178 4131 4109 4131 mri 408 1133 470 2164 nasa-giss 980 NaN 784 1693 nasa-gmao 198 NaN 828 828 ncar 214 1774 1132 1887 ncc 305 508 497 508 nicam 3 NaN 9 12 nimr-kma 4 15 5 25 noaa-gfdl 2918 323 3946 4309 noaa-ncep NaN NaN 300 NaN nsf-doe-ncar 170 415 240 426
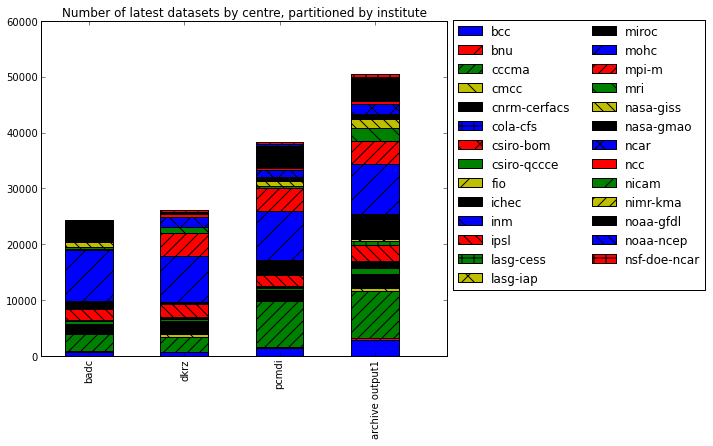
We can plot this data to emphasise the total replica of coverage and the coverage per institute
In[34]:
fig = plt.figure(figsize=(16,6))
ax = fig.add_subplot(1, 2, 1)
bars = df_institute.transpose().plot(kind='bar', stacked=True, ax=ax)
for i, patch in enumerate(bars.patches):
    hatches = ['', '/', '//', '\\', '\\\\', '+', 'x']
    j = i // 4 % 7
    patch.set_hatch(hatches[j])


# Put a legend to the right of the current axis
ax.legend(loc='center left', bbox_to_anchor=(1, 0.6), ncol=2)
ax.set_title('Number of latest datasets by centre, partitioned by institute')
Out[34]:
<matplotlib.text.Text at 0x4153410>
In[35]:
fig = plt.figure(figsize=(14,6))
ax = fig.gca()
df_institute.plot(kind='bar', ax=ax)
ax.legend(loc='upper right')
ax.set_title('Number of latest datasets replicated at each centre by institute')
Out[35]:
<matplotlib.text.Text at 0xa46d2d0>